LCD MASTER™ 1D/2D/3D
Modern Liquid Crystal Display Simulation tool
Overview
- Starting from 1993, LCD MASTER™ has been used by almost LCD cell makers, material suppliers and universities as standard LCD simulator in the world, Japan, Korea, Taiwan, China, US, European countries.
- LCD MASTER™ can be divided into mainly two functions. The first is “LC director distribution simulation” and the second is “Optical simulation”. “LC director distribution simulation” is also divided into one-dimensional, two dimensional and three dimensional from a view point of spatial symmetry.
- Current Customers include; Samsung, LG, Apple, Sharp among many others
LCD MASTER™ Overview
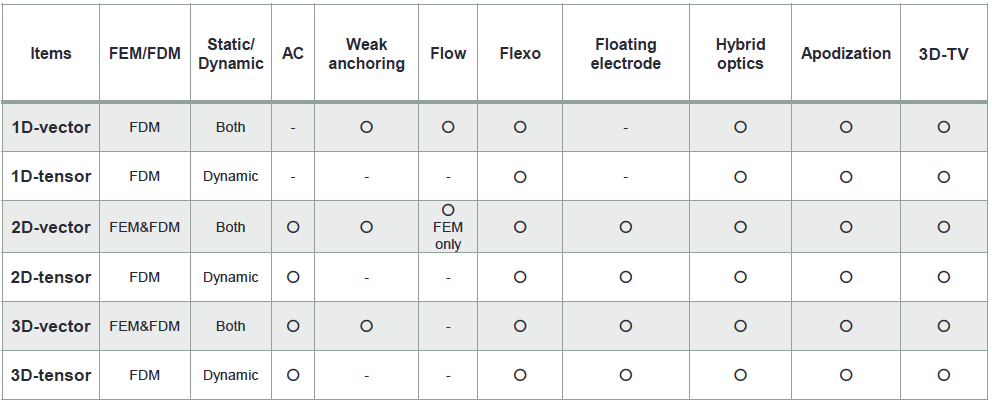
 LCD MASTER™/1D/2D/3D have mainly two functions, LC director and optical simulation
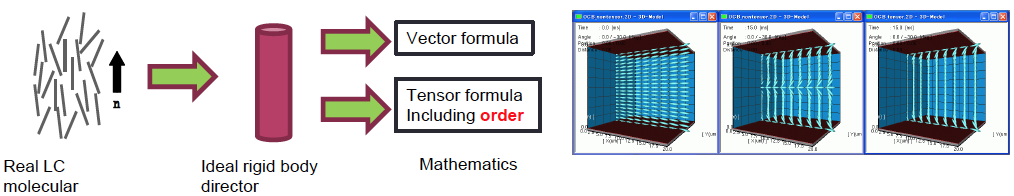
- There are vector and tensor formulae on LC director simulation
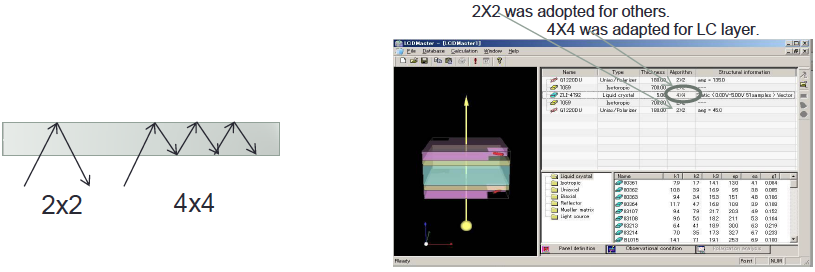
- 2X2, 4X4 and hybrid optical solution available for optical simulation
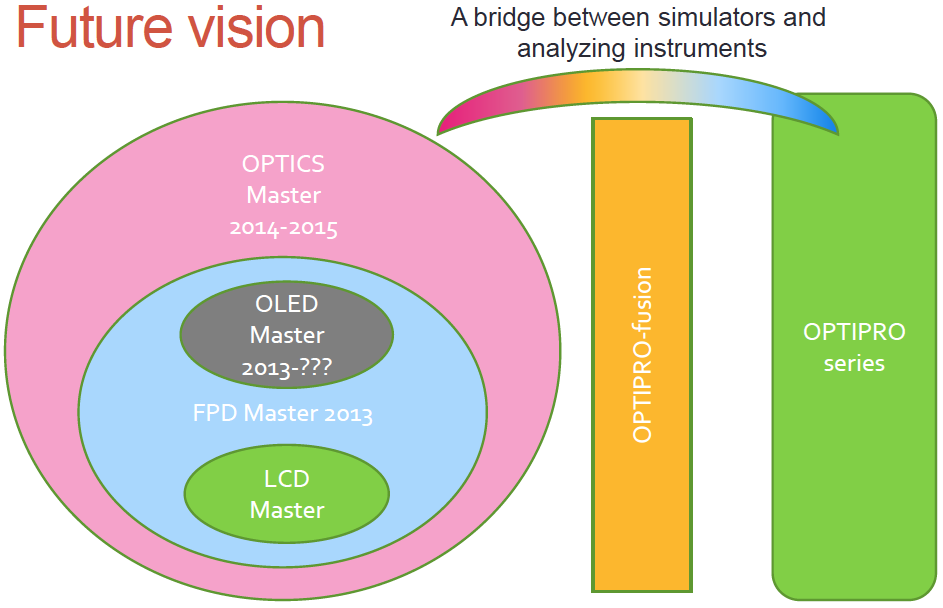
- LCD MASTER™ works tightly with OPTIPRO which can analyze optical properties of optical films and LC cells.
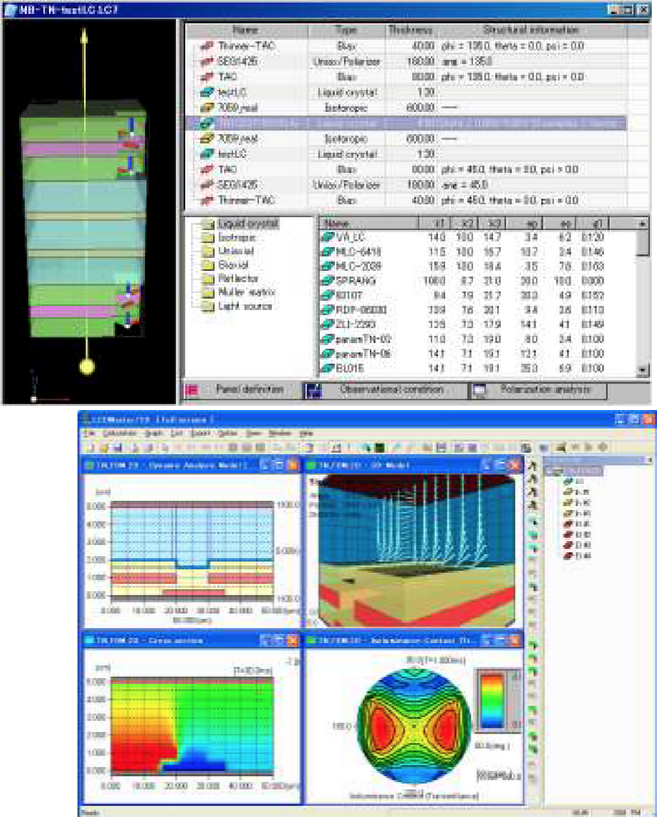
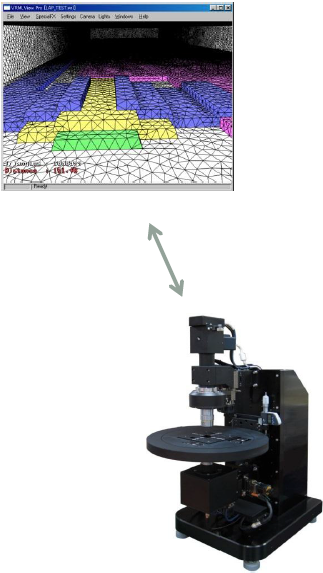
Simulation and Measurement
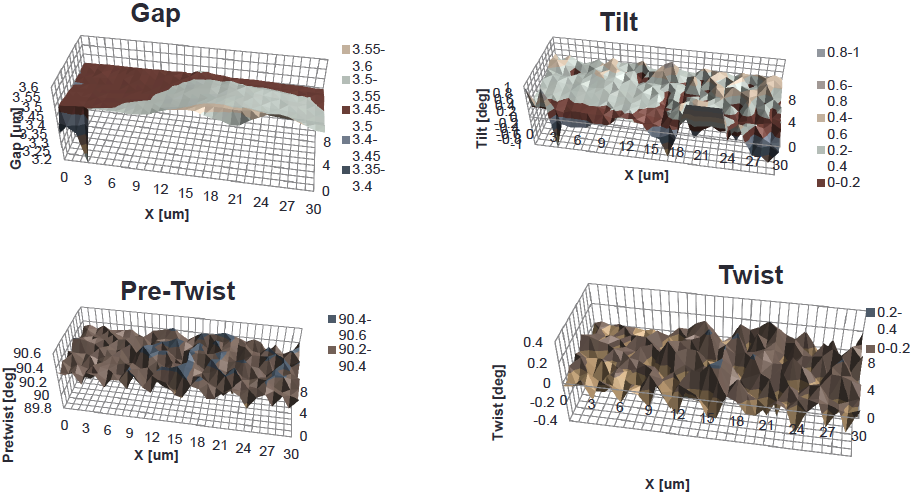
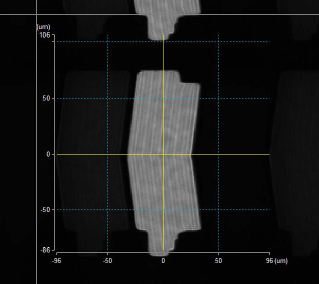 LCD MASTER™/3D can import LC alignment data from OPTIPRO-micro
- Let’s think there are two cells, A is good, B is not so good
- OPTIPRO-micro measures both cell parameters, cell gap, tilt and so on
- LCD MASTER™/3D calculate with those two kinds of actual initial alignment data
- LCD MASTER™ can be used for not R&D but quality control and evaluation.
 Click above to enlarge.
Powerful and sophisticated CAD!
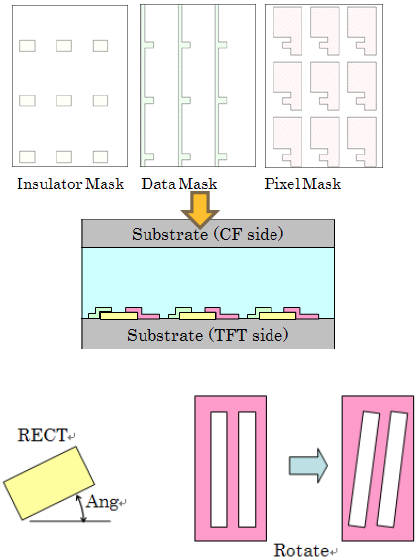 Authentic CAD is implemented into 2D and 3D
- Designers and Researchers can modify 2D, 3D geometry which has been imported from GDS data.
Easy to Modify Structure
Function list
 Click image above to enlarge.
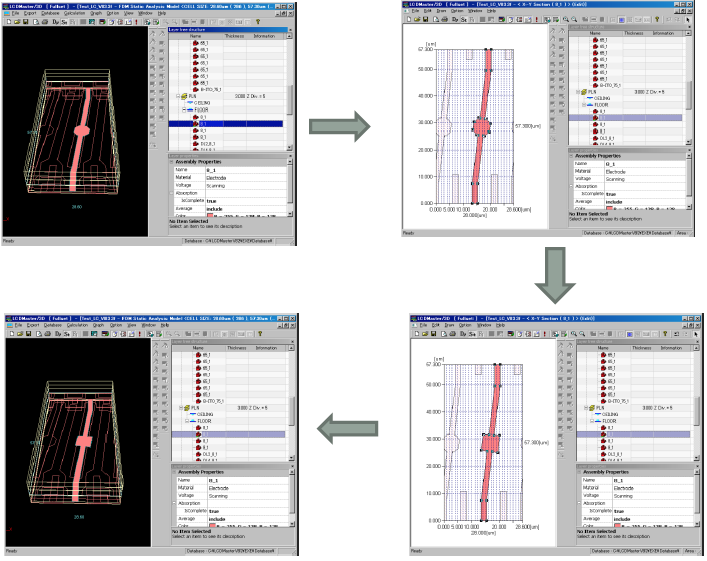
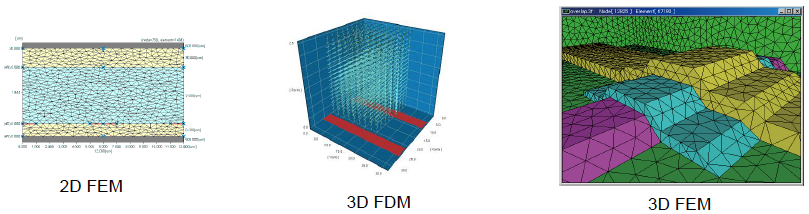
FEM and FDM
- FEM is effective for complicated structure
- FDM is for simple structure, high speed calculation and tensor simulation.
 Click image above to enlarge.
Tensor Order Parameter
The analyzing algorithm is like a microscopic simulator by using order parameters. The Q tensor can reveal not only n-directors direction but also scalar order parameter time change and spatial distribution. SHINTECH uses most rigorous theoretical formulae,different from de Gennes or Berreman’s Q-tensor explication, which is the first commercial simulator in the world!
 Click image above to enlarge.
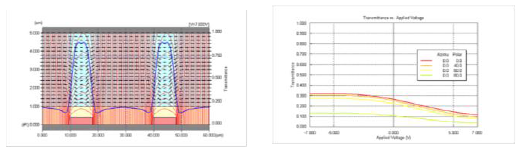
Static (V-T) Simulation
- The equilibrium state under the given voltage conditions is calculated. It can apply a fixed voltage or scanned voltages to each electrode. The scanning electrodes have both start and stop voltages. Static calculation is performed the number of times that is specified in calculation condition
- In FEM, calculation of conventional ratio 50 times is attained by a high-speed Static calculation solver, and a V-T curve can be generated in a short time.
Dynamic (time domain) Simulation
- Calculates and visualizes the director orientation in a two dimensional electric field generated by multiple electrodes having different potentials
- Facilitates estimation of the location of disclinations. Provides a user friendly and intuitive graphical user interface
- Enables flexible, interactive modeling of LC cell including multiple electrodes and insulators
- By auto-mesh generator you can obtain a meshed region and modify coarseness after mesh generation by clicking each point. (FEM only)
AC (Frequency Domain) Simulation
- Driving frequency affects the results if conductive substances are contained in analysis field
- Difference of electric conductivity and driving frequency make different electric field which makes different LC director distribution
- Thus different director distribution is induced by different electric conductivity and driving frequency
- The above conclusion suggests that lower voltage driving LC device can be developed by considering electric conductivity and driving frequency and by using “AC Statics” simulation, but, of course there may be opposite possibility.
 Click image above to enlarge.
Weak Anchoring and Flow Effect
Weak Anchoring
- Anchoring energy on the upper and lower LC boundary can independently be specified in azimuth and polar angle.
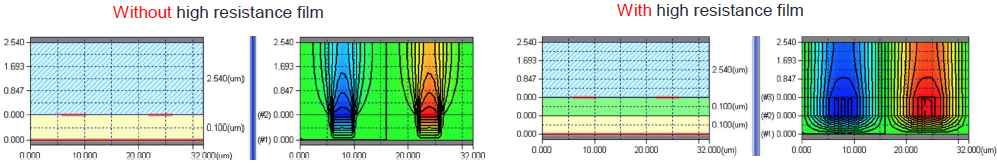
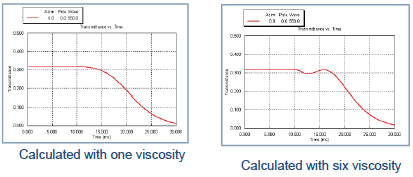
Flow
- It analyzes using six Leslie constants to time response calculation of a liquid crystal more correctly, and the back flow effect can be checked.
Flexoelectric Effect
- Flexoelectric effect is also supported which is observed as electric polarization when such splay or bend distortion occurs
- By specifying Flexoelectric coefficients e1 an e2, it can show more close real time-response or n-directors distribution.
 Click image above to enlarge.
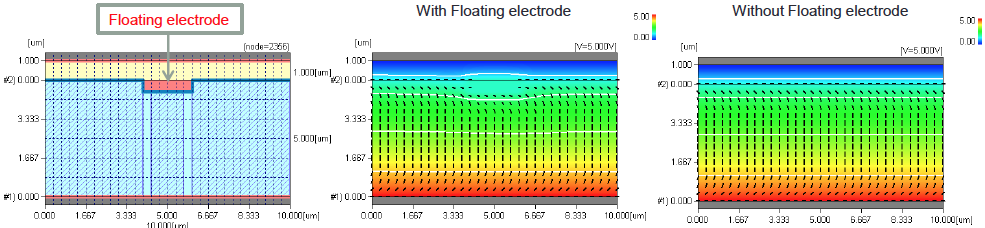
Floating Electrode
- The constant source of voltage is usually connected to a metal electrode, and the potential becomes settled. On the other hand, although it is a perfect conductor, since it does not connect anywhere, the electrode with which potential does not become settled is called Floating electrode. It is used when Black mask is realized by chromium, and this is modeled.
 Click image above to enlarge.
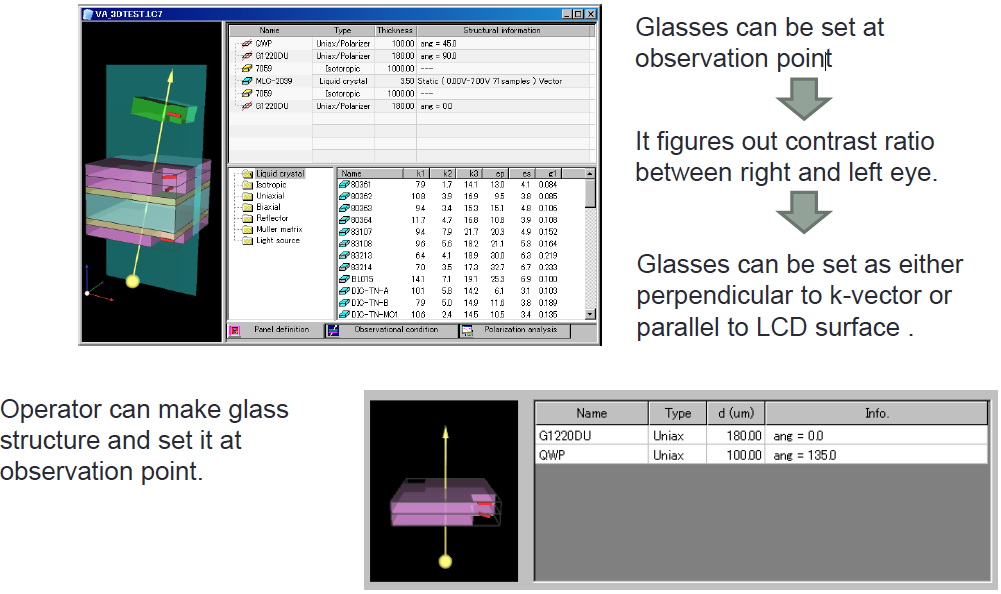
Hybrid Optics
- 2X2 considers one time reflection at the boundary
- 4X4 considers multiple reflections at the boundaries
- 2X2 is suitable to thicker material, like glass substrate
- 4X4 is suitable to thinner layers.
 Click image above to enlarge.
Apodization
- It is getting be more not negligible multi reflection in a polarizer, because each layer of the polarizer thickness is more thinner
- 4X4 algorithm is adequate to simulate the polarizer, but there is many ripples in a intensity-wavelength chart.
 Click image above to enlarge.
3D-TV Patterned Retarder Film